Manufacturing Analytics Software


Analyze. Predict. Take Action.
We have the data. Just bring the questions.
- Root Cause Analysis and Correction
- Cost Containment and Revenue Maximization
- Account/Prospect Loss/Growth Comparisons
- Business Sector Focus Analysis
- Evaluate Your Equipment and Staff Optimization
- Review Your Customer’s Satisfaction
- Evaluate Management Performance
Business Intelligence to Make Decisions.
Sales
Monitor information such as customer risk analysis (complaints and deliveries), sales trend analysis, contribution and profit, watch list of customers, quote hit analysis and sales team performance. Spot opportunities and quickly make decisions to drive sales, revenue, and profits upward.
Finance
Stay ahead of important areas like proactive credit management (aging and exposure), profit and loss trends, financial ratios, job cost analysis by plant and product type. Make sense of your business financial performance so your business can make money. Determine the best way to leverage your capital and expenditure budget.
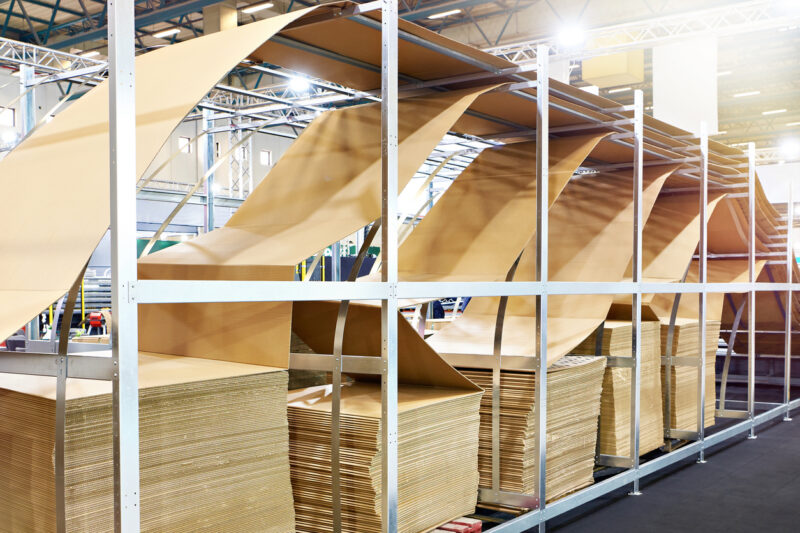
Production
Have a birds-eye view of plant floor performance with data demonstrating downtime and machine utilization, detailed waste tracking, visual speed and efficiency charts, estimated versus actual machine performance, and more. Take action and make adjustments faster to maximize every efficiency within your operations.
Scheduling
Gain insight into your backlog and spot trends that make forecasting simple. Visualize efficiency anomalies and drill-down to root cause. Visual Analysis for Scheduling ensures you always have actionable data at your fingertips.
Logistics
View your delivery fleet in real-time with estimated time of arrivals (ETA) by truck and trip, real-time truck locations on a visual map, on-time deliveries, short shipment tracker, etc. Satisfy your customer needs with fast response to information and better manage the logistics of your operations.
Full Integration
Integrated into Amtech’s ERP Eco-System, every point of information is delivered to you for easy analysis of your entire Amtech-powered operation. With real-time information, not near-time, and with full integration instead of limited interfaces, you have the business intelligence to make immediate decisions for your business.
Take Analytics Further with Amtech’s Data Warehouse
While Visual Analytics can run against your EnCore database, take your data journey further and opt for the EnCore Data Warehouse. Not only does this free your transactional server from reporting load, but you can also integrate the Data Warehouse with third party systems into our powerful repository which delivers to you a global and holistic view of your entire operation. Now, impactful decisions can be made to increase profits and drive revenue with greater confidence.
Multiple levels of security and access provide users with location, role-based, and departmentalized security where users can analyze data particular to subject areas that are important and necessary for them such as “sales” or “production.”
The platform delivers endless possibilities for reporting and alerts. Users can set up data pushes for information when they want and how they need it. Combined with dashboards, all information is analyzed and considered for making valuable decisions.
Combined with dashboards, all information is analyzed and considered for making valuable decisions.

Hear from EnCore ERP customers on how Amtech Visual Analytics has improved performance
Amtech's Visual Analytics has been a gamechanger for our business. It has provided us with the insights we need to make data-driven decisions and improve our overall performance. The user-friendly interface and customizable dashboards make it easy for our team to access and understand the data.
Scott Sumner, Vice President, Complete Design & Packaging
Ready to learn more?
Please fill out this form and hit Submit and we will get back to you.
"*" indicates required fields